Learn
Your First Investigation
This page walks you through your first session from launch to graded result: what happens while your range builds, how the session page works, what you'll find inside the lab, and where to turn when you get stuck. Nothing here spoils an investigation, so read it before your first run or keep it open beside one.
The screenshots follow Operation Silverfish, an intermediate scenario. Your briefing and your questions will differ; the flow will not. Click any screenshot to open it full size.
Keep the session page open in its own browser tab from launch until you finish and grade. It is your scorecard, your way into the lab, and your way back in if anything goes wrong.
Launching a scenario
Every scenario page has a launch button. Click it and you land on the session page, which stays with you for the whole run. It opens in a provisioning state while the platform builds your range: deploying the environment, correcting clocks, and firing the attack chain. This usually takes a couple of minutes, and there is a better use for them than watching the status line.
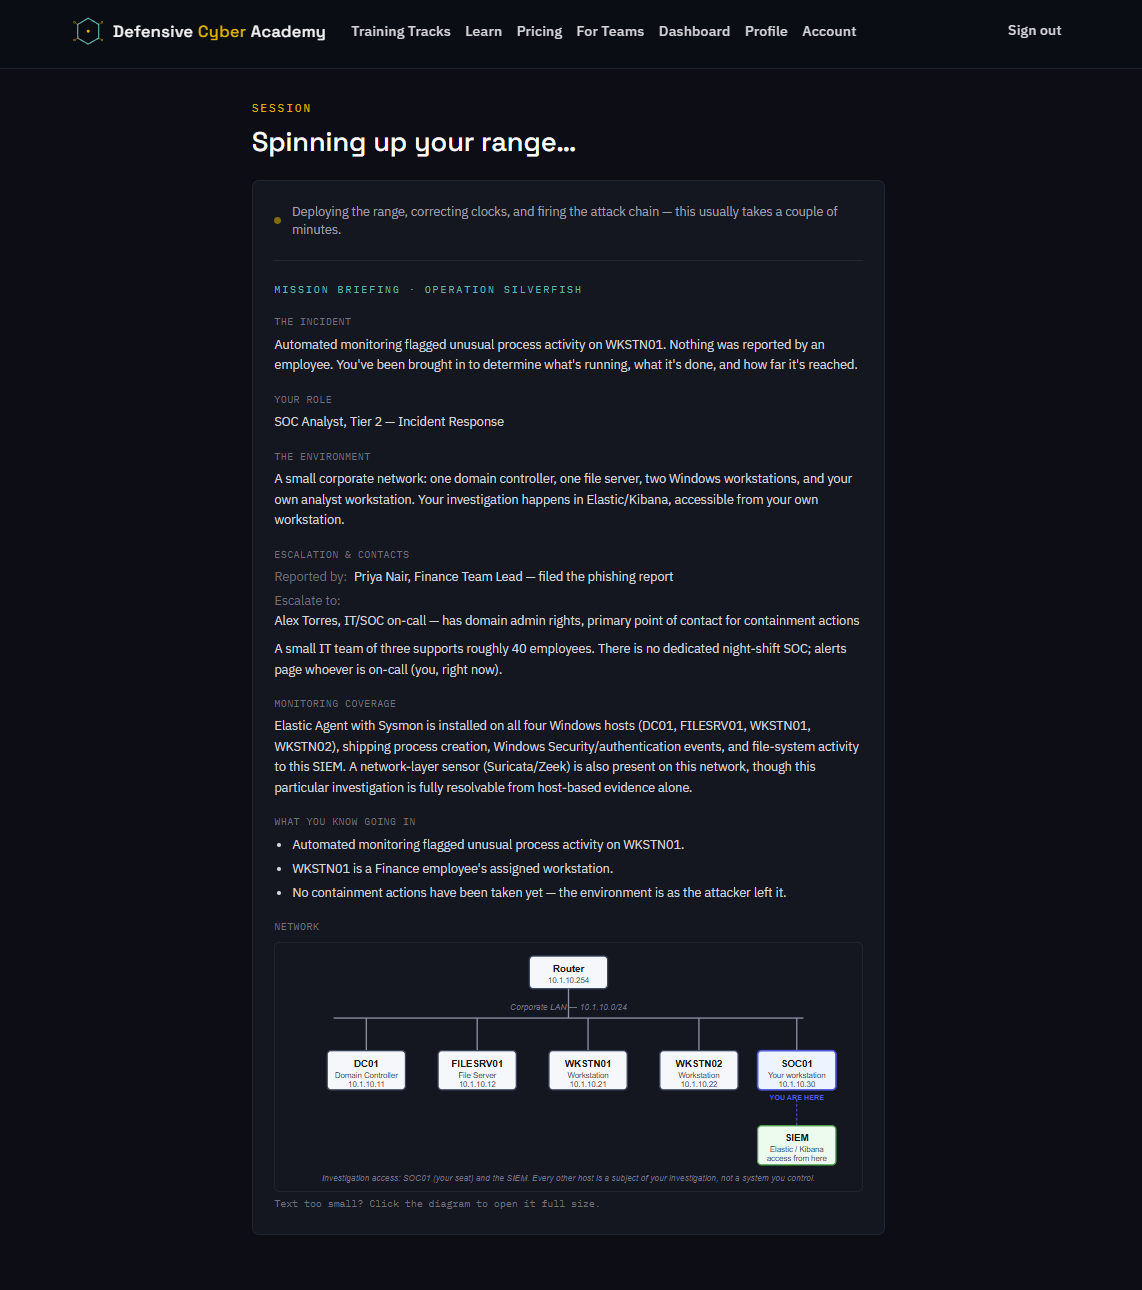
Below the status line sits the mission briefing, and it deserves your full attention while you wait. It tells you what was reported and by whom, the role you're playing, the shape of the network, who you'd escalate to, and, under Monitoring Coverage, exactly which telemetry sources are instrumented. That last section is worth returning to mid-investigation: it is written truthfully, and it tells you where evidence can and cannot exist. The network map at the bottom opens full size with a click; keep its host names and addresses within reach, because the questions you're about to answer are anchored to them.
One thing the briefing implies that is worth saying plainly: by the time you get in, the attack has already happened. You arrive the way a real analyst does, after the fact, with the adversary's traces sitting in the logs exactly as they landed.
When provisioning completes, the page header flips to Live and two things appear: a countdown and an Open range button.
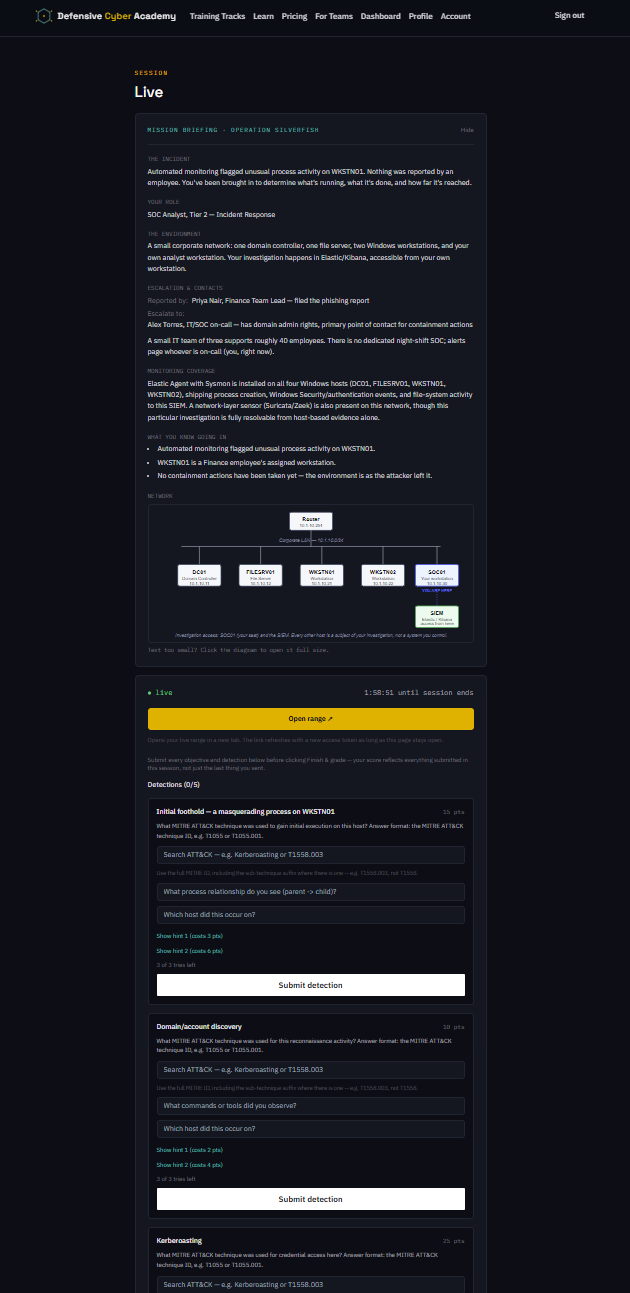 The session page once the range is
live: the countdown, Open range, and the first detection cards.
The session page once the range is
live: the countdown, Open range, and the first detection cards.
The countdown is a hard limit. The range is torn down automatically when it reaches zero, whatever state your investigation is in, so keep an eye on it and don't leave finishing to the last minute. Open range launches the actual lab environment in a new tab; the link refreshes with a new access token for as long as the session page stays open, which is one more reason to leave that tab alone.
Detections and objectives
The working half of the session page is two lists of questions. Both are open from the moment the range is live, both can be answered in any order, and everything you submit counts toward the same final score.
Detections each cover one stage of the attack, named for what monitoring saw: an initial foothold on a workstation, a burst of account discovery, a credential attack, whatever the chain contains. A detection asks you to identify the MITRE ATT&CK technique behind that stage, then to back the identification with evidence from the telemetry: which host, which process relationship, which account, whatever fits the stage. Three things matter about the technique answer:
- Credit for a detection always requires the technique to be correctly identified. Evidence alone earns nothing, so settle the identification first.
- Give the full ID, including the sub-technique suffix where there is one:
T1558.003, notT1558. The search box under the question accepts a technique name or an ID and hands you the exact form to submit. - Each scenario's dashboard card also shows its techniques, just above Launch. That's a starting point once you have a hypothesis, not the answer. Look up the matching technique in the TTP Catalog to see what its telemetry actually looks like and how to search for it. Real analysts do this constantly, so build the habit early.
Answer these to the best of your ability. Confirmed detections are not just points: each one pins down a stage of the chain, and together they sketch the story the objectives will ask you to tell.
Objectives are the concrete facts of the case: which host was compromised first, which account the attacker took, what left the network. Each takes a single answer. The final objective is different: it closes the incident out, and it expects you to bring together everything the earlier objectives established. Naming what you found is what completes the scenario, so treat it as your incident report in miniature rather than a new puzzle.
A few rules apply to every question, detection and objective alike:
- Three tries per question. A wrong submission costs one, and when all three are gone the question locks with whatever credit you've earned. Check the telemetry before you submit rather than testing guesses against the grader.
- Partial credit stays open. A correct technique with thin evidence scores partial credit on a detection, and the form stays open while tries remain. You can come back with better evidence and upgrade it.
- Hints cost points. Every question carries hints with the price on the button, and the cost comes off your final score the moment you reveal one. Spent well, a hint is cheap: if you're down to your last try, a few points for a nudge usually beats a locked question.
- A perfect sheet is not required. You don't need to answer every detection question to receive full credit for the run. If something locks, let it go and keep working the incident.
When you've submitted what you can, click Finish & grade. Grading scores everything submitted during the session, not just the most recent answer, so there is nothing to save for last. It also closes the lab out: the range is torn down, and once your result is on screen it is safe to close the browser.
Closing out matters more than it might sound, because you have one active lab at a time. A session you abandon keeps holding that slot until its timer runs out, and a new launch is refused while it does (with a pointer back to the session you left). Finish & grade is how you free the slot on your own terms, with everything you submitted scored, rather than waiting for the clock to do it for you.
Inside the lab
Open range opens Elastic itself in a new tab. There is no intermediate machine and nothing to launch first: the tab is the SIEM, and the investigation starts as soon as it loads. Which view greets you depends on the scenario: some land you in the Security app's alert queue with detections already firing, others put you straight into Discover to hunt from raw telemetry. If Kibana itself is new to you, Using Elastic Security is the primer; this page assumes you can find Discover and run a query.
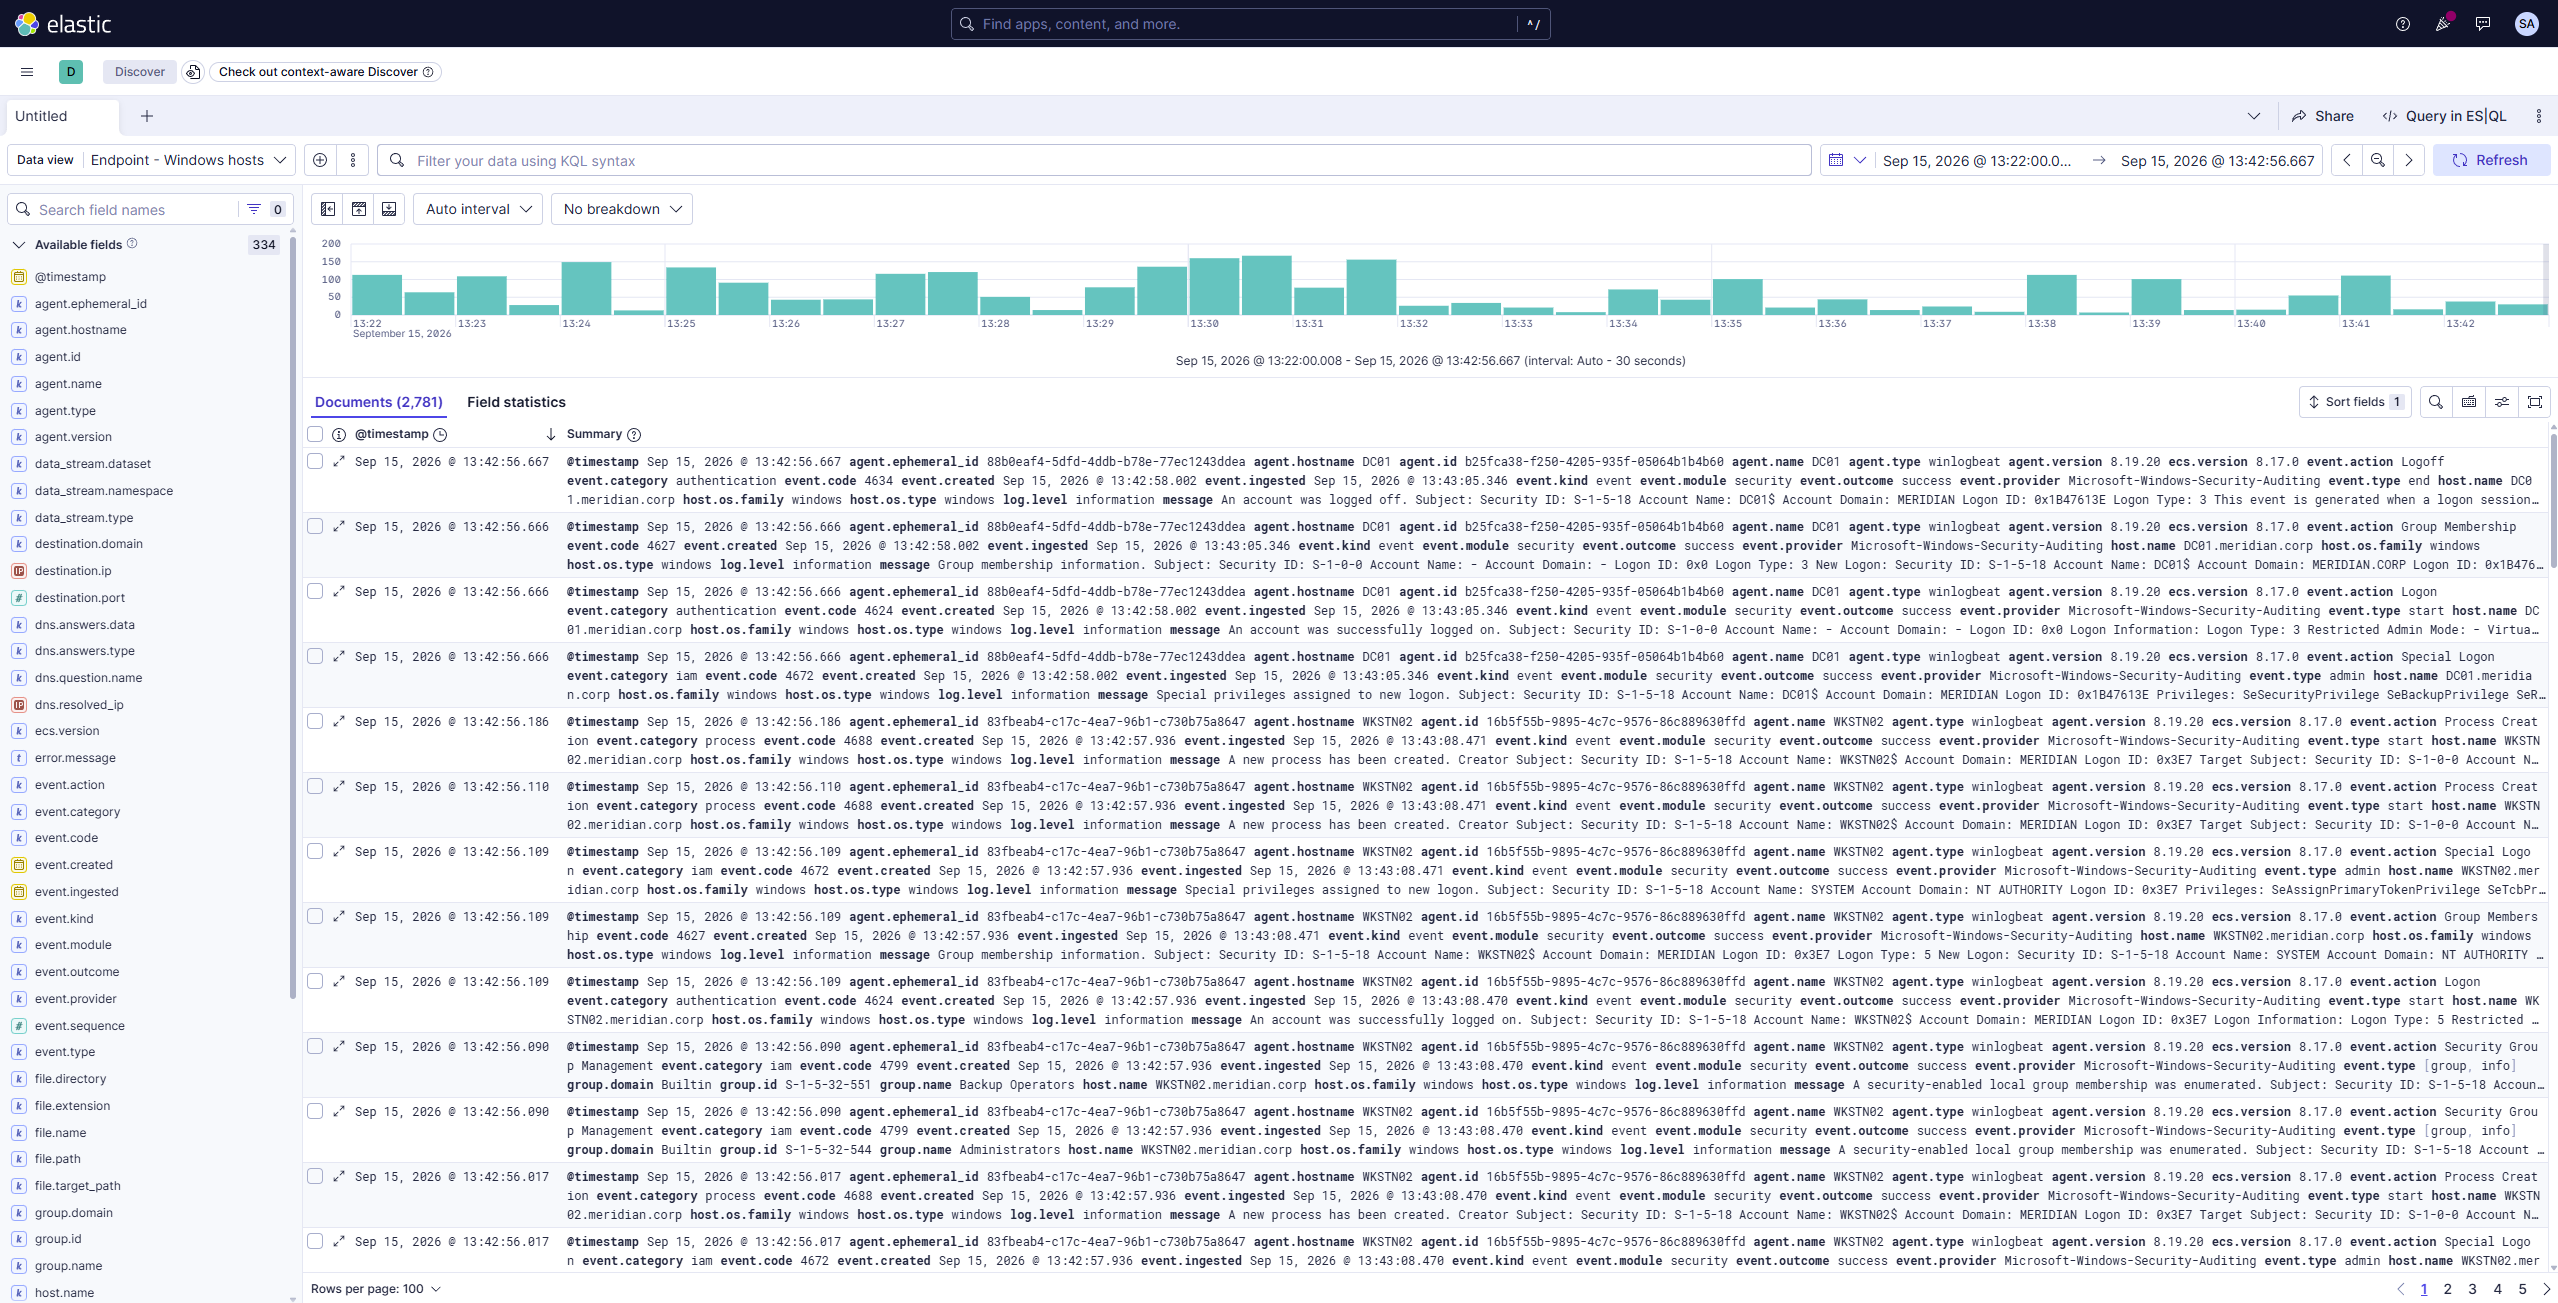
It is worth being clear about what this is not: you are not inside the compromised network. The hosts in your scenario were captured as the attacker left them, and there is no console, RDP, or network path to any of them. Everything you can know about the incident is already in the SIEM. That is the exercise: triage from telemetry alone, exactly as you would for an estate you don't personally administer.
Badges and medals
Finishing a scenario is worth more than the number on the results screen. Every scenario you pass earns its badge: one piece of the collection on your profile, with artwork drawn for that scenario.
The Operation Silverfish badge with a gold stamp. This is the live badge, drawn by the same code your profile uses.
The stamp in the corner is your medal, and it reflects how well you scored, not just that you passed: one dot for bronze, two for silver, three for gold, earned at score thresholds each scenario sets. Only your best run counts. Replaying a scenario can upgrade the stamp and never downgrades it, so a rough first attempt costs nothing in the long run.
If you're stuck
Every scenario is solvable from the telemetry you have. When progress stalls, it is almost always one of these:
- Widen the time picker before you doubt your query. This is the number one reason a correct query returns nothing. The telemetry in a lab is captured history, not live data, and Discover defaults to a recent time window, so a perfectly good query can land outside the incident entirely. Set the picker wide (Last 1 year is a fine start), confirm you can see data at all, then narrow back down.
- Check that the field you're searching can exist in the records you're searching. Each telemetry
family has its
own vocabulary, and a field from one simply does not exist in another.
event.codeis a Windows event log field, so pointing a query at network telemetry finds nothing: those records describe connections and sessions, not Windows events. It's a confusing dead end precisely because nothing errors; the query is well-formed, it just quietly matches zero documents. The families you will work across are Windows event log records, endpoint records of process, file and registry activity from Sysmon, and network records of connections, sessions and alerts. Each announces what it holds: switch the data view in Discover and read its field list rather than assuming a field is universal. - Look the technique up in the TTP Catalog. When a detection names a stage you only half-recognize, the TTP Catalog entry for that technique tells you what it looks like in exactly this telemetry, which fields to check, and how to tell the real thing from a look-alike. Keep it open in a tab beside the lab.
- Re-read Monitoring Coverage in the briefing. It states plainly which sensors exist, and often which kinds of evidence the investigation does and doesn't need. If the briefing says an incident is fully resolvable from host telemetry, hours spent in the network indices are hours in the wrong place.
- If a right-looking technique is marked wrong, check the suffix. Detections grade the precise sub-technique. Pick your answer from the search box rather than typing an ID from memory, and where a sub-technique exists, submit it in full.
- Don't spend tries as guesses. Three tries is enough for an evidence-backed answer and a correction, not for brute force. If you're genuinely unsure and down to your last try, reveal a hint first; the few points it costs are usually cheaper than a lock.
- A locked question is not a failed run. Move on. Detections guide the investigation, but the objectives carry the incident, and the final summary is what completes the scenario.
- Closed something you needed? For the lab tab, click Open range again; the link stays valid while the session page is open. For the session page itself, reopen it from your dashboard: submissions are saved server-side, and the session resumes where you left it.
That's the whole loop: launch, read the briefing, work the telemetry, submit as you go, then Finish & grade. Treat your first run as learning the workflow. The scores and the medals follow on their own once the workflow is comfortable.
Where to go from here